This function plots values corresponding to each month on a rose plot.
Arguments
- mvalue
A numeric vector of length 12, with values for each month (Jan–Dec). If you have it in a data frame, extract it (e.g.
data$mvalue).- lgnm
Title of the legend (default
"Value").- width
Width of bars.
- high
Color name for high values (default
"yellow").- low
Color name for low values (default
"green").
See also
day_chart() for plotting values on a day by hours
week_chart() for plotting values in a week by days
cyclic_chart() for plotting values by arbitrary period
Examples
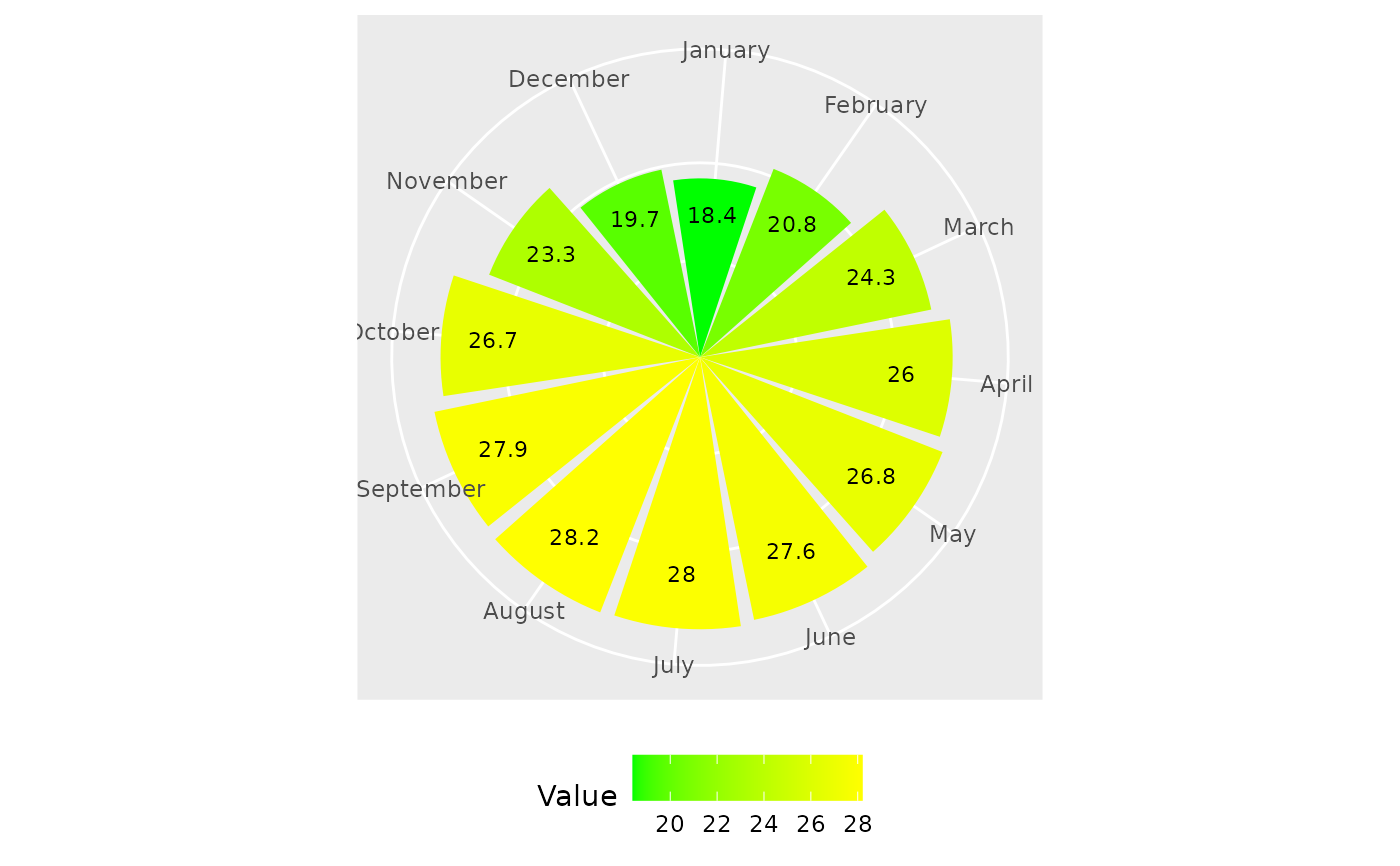
syltmp <- c(18.4, 20.8, 24.3, 26.0, 26.8, 27.6, 28.0,
            28.2, 27.9, 26.7, 23.3, 19.7)
year_chart(mvalue = syltmp)