This function plots values corresponding to each hour on a rose plot.
See also
week_chart() for plotting values in a week by days
year_chart() for plotting values on in a year by months
cyclic_chart() for plotting values by arbitrary period
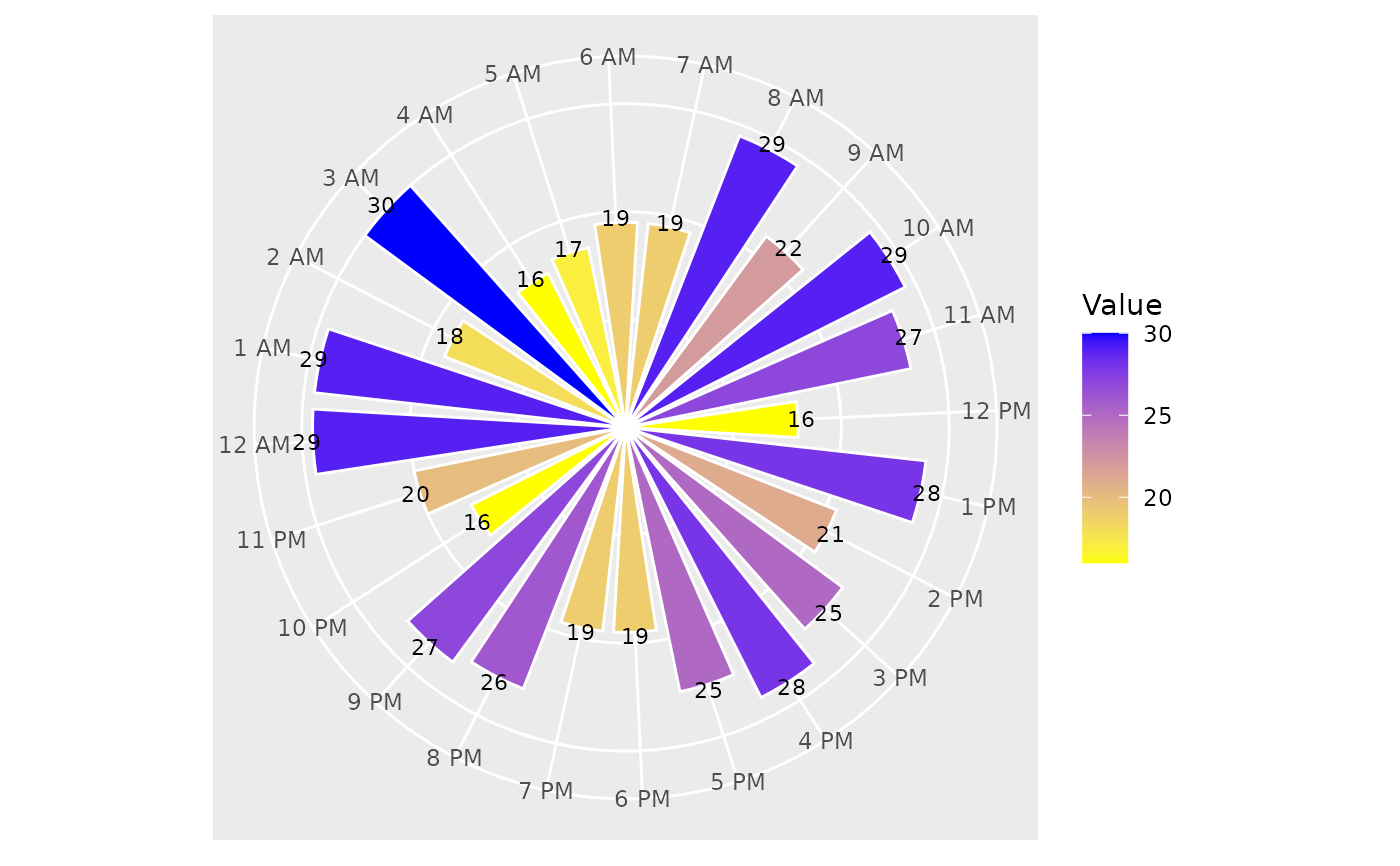
Examples
value <- sample(15:30, 24, replace = TRUE)
day_chart(hvalue = value, high = "blue", low = "yellow", width = 0.8)