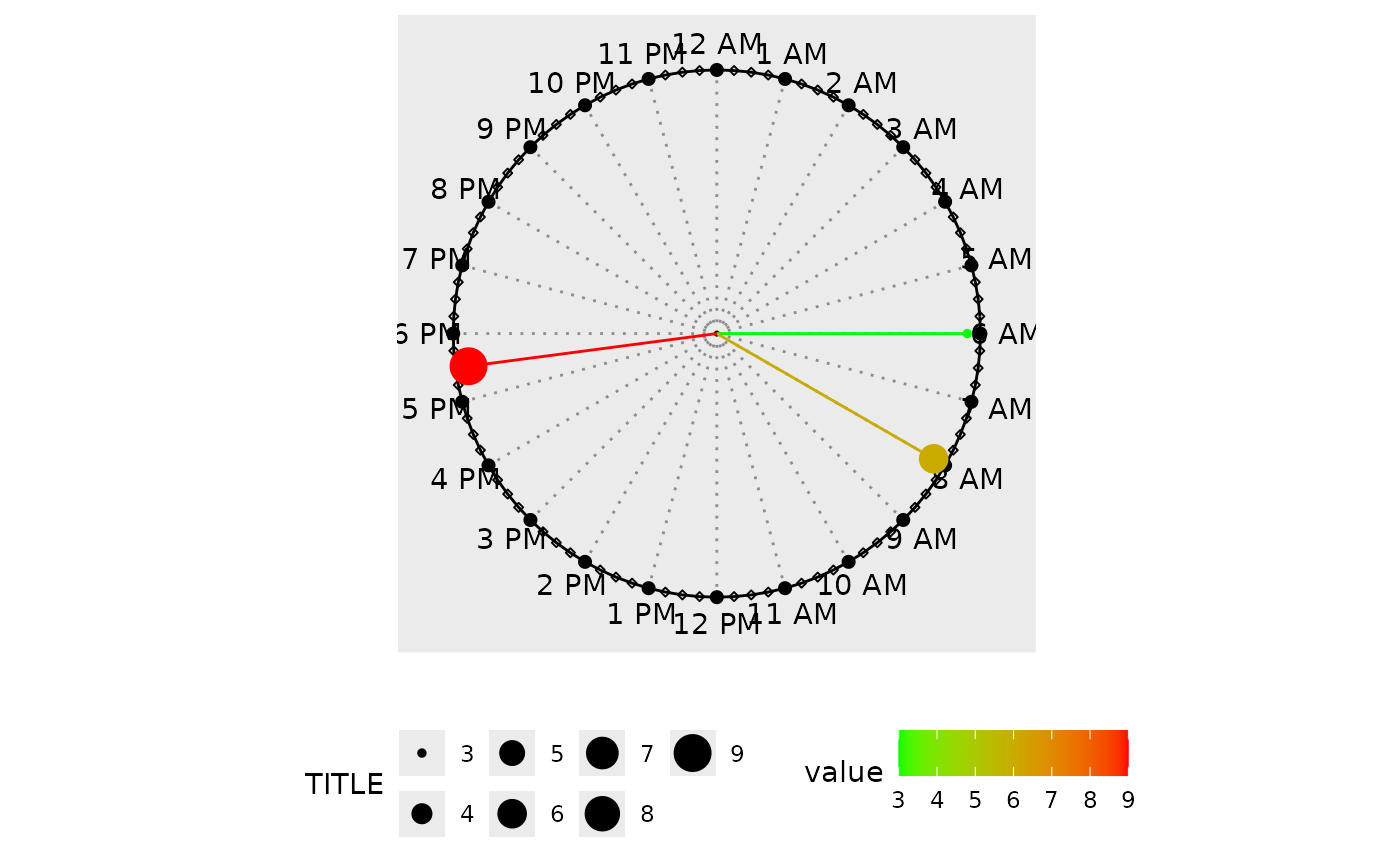
This function will plot time of events on a 24 hour clock to show which events took place at what times. The lines are colored by a criteria.
Arguments
- data
A data frame
- time
Time in 24 hours. The allowed time formats for these family of charts are
HH:MM:SS,HH:MMor evenH:M(such as12;30:09or9:3).- crit
a numeric vector by which lines will be colored.
- high
The color name for the high values. The default is
red- low
The color name for the low values. The default is
green. The color names can be vice versa or other colors, depending on the context.
Details
Change the title, subtitle or the caption of the plot with
ggplot2::labs() .Change the legend title by adding
ggplot2::labs(size = "TITLE") or labs(color = "TITLE").
Add
or modify legend by theme(legend.position = "POSITION"); the valid
position names in ggplot2 are top, bottom, right, and left,
excluding more complex options.
Examples
df <- data.frame(
  time = c("06:00:00", "08:00:00", "17:30:00"),
  value = c(3, 6, 9)
)
clock_chart_col(df, time, crit = value) +
  ggplot2::labs(size = "TITLE")