Introduction to Statistics
Lecture 01 — Basic Concepts & Foundations
Statistics: What & How
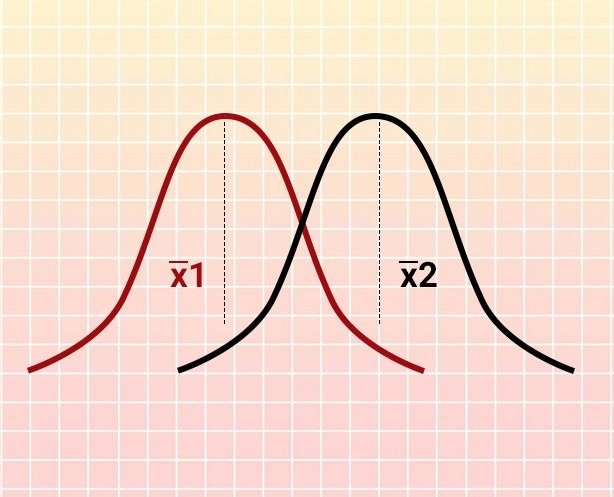
Topics
- What is Statistics?
- How Statistics Works
- Probability and Statistics
- Applications of Statistics
- Example Problems
What is Statistics?
Three Meanings of “Statistics”
- Plural of statistic — numerical facts (e.g., “the statistics show 60% approval”)
- Table of data — organized numerical information
- Methodology — the science of collecting, organizing, analyzing, and interpreting data
Definition (Croxton & Cowden): Statistics is the science of collection, presentation, analysis, and interpretation of numerical data.
How Statistics Works
The Statistical Process
- Population → Define the group of interest
- Sample → Select a representative subset
- Analyze → Apply statistical methods
- Infer → Draw conclusions about the population
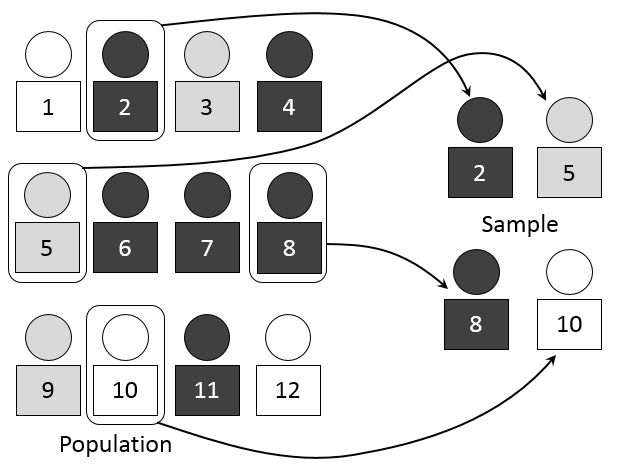
There are many sampling techniques: simple random, stratified, cluster, systematic, etc.
Probability vs. Statistics
| Aspect | Probability | Statistics |
|---|---|---|
| Direction | Population → Sample (deductive) | Sample → Population (inductive) |
| Known | Population parameters | Sample data |
| Unknown | Sample outcomes | Population parameters |
| Question | “Given the model, what data?” | “Given the data, what model?” |
Applications of Statistics
- Identification of unwanted spam messages in e-mail
- Segmentation of customer behavior for targeted advertising
- Forecasts of weather and long-term climate changes
- Prediction of election outcomes
- Algorithms for auto-piloting drones & self-driving cars
- Optimization of energy use in buildings
- Crime hotspot projection
- Discovery of genetic sequences linked to diseases
Chapter 01: Basic Concepts
Chapter Overview
- Definition & Mechanism of Statistics
- Population and Sample
- Variable Types
- Scales of Measurement
- Summation Notation & Theorems
- Mathematical Problems
Mechanism of Statistics
The statistical workflow involves five stages:
- Data Collection — Gathering raw information
- Organization — Tabulating, grouping, coding
- Presentation — Tables, charts, graphs
- Analysis — Descriptive & inferential methods
- Interpretation — Drawing meaningful conclusions
Population and Sample
Population — The complete set of items/events of interest Sample — Any subset of the population
Population Types
| Type | Description | Examples |
|---|---|---|
| Finite | Countable, limited size | Students in a classroom, books in a library, employees in a company |
| Infinite | Uncountable, unlimited | Stars in the sky, outcomes of infinite coin flips, water molecules in the ocean |
Variable and Constant
| Concept | Description | Examples |
|---|---|---|
| Variable | Characteristic that varies across units | Income, height, GPA, die roll result |
| Random Variable | Variable whose value depends on chance | Result of a die throw, number of heads in 10 flips |
| Constant | Fixed, unchanging value | \(\pi\), \(e\), speed of light in vacuum |
Note: “Name of students” is a label (qualitative variable), not a constant.
Types of Variables
By Nature of Data
| Type | Also Called | Values | Examples |
|---|---|---|---|
| Qualitative (Categorical) | Non-numeric | Categories, labels | Gender, religion, blood type, color |
| Quantitative (Numerical) | Numeric | Numbers with magnitude | Income, temperature, height, GPA |
By Continuity (Quantitative Only)
| Type | Description | Examples |
|---|---|---|
| Discrete | Countable, gaps between values | Number of children, die roll, defect count |
| Continuous | Any value in an interval | Height, weight, temperature, time |
By Role
- Univariate — One variable studied
- Bivariate — Two variables studied
- Multivariate — Multiple variables studied
Scales of Measurement
Describes the nature of information within the values assigned to a variable.
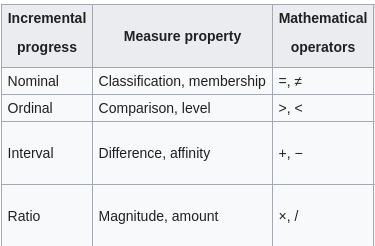
| Scale | Properties | Operations | Examples |
|---|---|---|---|
| Nominal | Categories only, no order | \(=, \neq\) | Gender, religion, blood type, street #, room # |
| Ordinal | Categories with order | \(=, \neq, <, >\) | Rating (poor–excellent), income group, education level |
| Interval | Order + equal intervals, no true zero | \(=, \neq, <, >, +, -\) | Temperature (°C/°F), dates (AD), IQ scores, Cartesian coordinates |
| Ratio | Order + equal intervals + true zero | All arithmetic | Height, weight, income, distance, radius, diameter |
Key distinction: Interval scales lack a true zero (0°C ≠ “no temperature”); ratio scales have meaningful zero (0 kg = no mass).
Scale Examples — Practice
Classify each variable:
| Variable | Scale | Reason |
|---|---|---|
| Gender | Nominal | Categories, no order |
| Religion | Nominal | Categories, no order |
| Temperature (°C) | Interval | Equal intervals, no true zero |
| Income group (Lower, Middle, High) | Ordinal | Ordered categories |
| Income ($) | Ratio | True zero, all operations valid |
| Distance of stars | Ratio | True zero, measurable |
| Radius of screws | Ratio | True zero, measurable |
| Diameter of trees | Ratio | True zero, measurable |
| Room number | Nominal | Label only, no magnitude |
Another Example — Match the Scale
| Data | Correct Scale | Why |
|---|---|---|
| Poor, Bad, Good, Excellent | Ordinal | Ordered categories |
| Scale of −10 to 10: −10, −2, 0, 5, 10 | Interval | Equal intervals, arbitrary zero |
| Awesome, Amazing, Mind-blowing, Stunning | Ordinal | Ordered by intensity |
| Scale of 0 to 10: 0, 5, 8, 10 | Ratio | True zero, equal intervals |
⚠️ Common mistake: “Poor–Excellent” is ordinal (not ratio); “Awesome–Stunning” is ordinal (not nominal).
Interval Scale — Special Properties
Multiplication/division are not meaningful on interval scales:
- Temperature: 20°C is not “twice as hot” as 10°C
- Dates: Year 2000 is not “twice” Year 1000
- Cartesian coordinates: (2,2) is not “twice” (1,1)
- Direction in degrees: 90° is not “twice” 45°
For more: Wikipedia — Level of measurement · Stat Mania discussion
Operations Allowed by Scale
Origin and Scale Shifts
Given data \(x_1, x_2, \dots, x_n\):
| Transformation | Formula | Effect |
|---|---|---|
| Origin shift | \(y_i = x_i \pm a\) | Adds/subtracts constant |
| Scale shift | \(y_i = b \cdot x_i\) or \(x_i / b\) | Multiplies/divides by constant |
| Both (standardization) | \(y_i = \frac{x_i - a}{b}\) | Center & scale (e.g., z-scores) |
Why? To compare variables on different scales, simplify calculations, or meet model assumptions.
Summation Notation
\[\sum_{i=1}^n x_i = x_1 + x_2 + \cdots + x_n\]
Examples: - \(\sum_{i=1}^4 x_i = x_1 + x_2 + x_3 + x_4\) - \(\sum_{i=1}^{10} x_i = x_1 + x_2 + \cdots + x_{10}\) - \(\sum_{i=1}^n a = n a\) (summing a constant \(n\) times)
Summation Theorems
Theorem 1: Constant Multiple
\[\sum_{i=1}^n b x_i = b \sum_{i=1}^n x_i\]
Theorem 2: Linear Transformation
\[\sum_{i=1}^n (a x_i - b) = a \sum_{i=1}^n x_i - n b\]
Theorem 3: Quadratic Form
\[\sum_{i=1}^n (a x_i^2 - b x_i + c) = a \sum_{i=1}^n x_i^2 - b \sum_{i=1}^n x_i + n c\]
Theorem 4: Two Variables
\[\sum_{i=1}^n (a x_i - b y_i) = a \sum_{i=1}^n x_i - b \sum_{i=1}^n y_i\]
Theorem 5: Squared Linear Form
\[\sum_{i=1}^n (a x_i - b)^2 = a^2 \sum_{i=1}^n x_i^2 - 2ab \sum_{i=1}^n x_i + n b^2\]
Theorem 6: Square of Sum vs Sum of Squares
\[\left(\sum_{i=1}^n x_i\right)^2 = \sum_{i=1}^n x_i^2 + 2\sum_{i < j} x_i x_j\] > Key: \((\sum x_i)^2 \neq \sum x_i^2\) (cross-product terms!)
Product Notation
\[\prod_{i=1}^k x_i = x_1 \times x_2 \times \cdots \times x_k\]
Theorem 7: Product of Products
\[\prod_{i=1}^k (x_i y_i) = \left(\prod_{i=1}^k x_i\right)\left(\prod_{i=1}^k y_i\right)\]
Theorem 8: Constant Product
\[\prod_{i=1}^n c = c^n\]
Double Summation
Given \(X = \{20, 25, 15\}\), \(Y = \{15, 30, 20\}\):
\[\sum_{i=1}^3 \sum_{j=1}^3 x_i y_j = (20+25+15)(15+30+20) = 60 \times 65 = 3900\]
Row-by-row expansion: - Row 1 (\(x_1=20\)): \(20(15+30+20) = 1300\) - Row 2 (\(x_2=25\)): \(25(15+30+20) = 1625\) - Row 3 (\(x_3=15\)): \(15(15+30+20) = 975\) - Total: \(3900\)
Double Summation Theorems
Theorem 9: \(\displaystyle \sum_{i=1}^m \sum_{j=1}^n (x_i + y_j) = n\sum_{i=1}^m x_i + m\sum_{j=1}^n y_j\)
Theorem 10: \(\displaystyle \sum_{i=1}^m \sum_{j=1}^n x_i y_j = \left(\sum_{i=1}^m x_i\right)\left(\sum_{j=1}^n y_j\right)\)
Practice Problems
Problem 1
Given \(f_1=2, f_2=4, f_3=6\) and \(x_1=-3, x_2=7, x_3=4\), find: - i. \(\sum f_i x_i\) - ii. \(\sum f_i x_i^2\) - iii. \(\sum f_i (x_i - 5)^2\)
Problem 2
Find \(\sum_{i=1}^{10} (x_i - 4)\) given \(\sum_{i=1}^{10} x_i = 20\).
Problem 3
Prove: \(\sum_{i=1}^k ab x_i = ab \sum_{i=1}^k x_i\)
Problem 4
Prove: \(\prod_{i=1}^n c = c^n\)
Problem 5
Given \(\sum_{i=1}^{10} x_i = 20\) and \(\sum_{i=1}^{10} x_i^2 = 400\), find \(\sum_{i=1}^{10} (x_i^2 + 5x_i + 10)\).
Problem 6
With \(X = \{20, 25\}\), \(Y = \{15, 30\}\): - i. Show \(\sum X_i^2 \neq (\sum X_i)^2\) - ii. Show \(\sum X_i Y_i \neq \sum\sum X_i Y_j\)
Creative Questions
See the question bank: STAT1 Creative Questions
Creative Question 2
| Income (\(x\)) | 120 | 130 | 88 | 150 | 175 | 144 | 180 | 200 | 160 | 155 |
|---|---|---|---|---|---|---|---|---|---|---|
| Expense (\(y\)) | 80 | 120 | 70 | 100 | 160 | 114 | 170 | 195 | 140 | 131 |
Prove: 1. \(\displaystyle \sum_{i=1}^{10}\sum_{j=1}^{10} x_i y_j = \left(\sum_{i=1}^{10} x_i\right)\left(\sum_{j=1}^{10} y_j\right)\) 2. \(\displaystyle \sum_{i=1}^{10}\sum_{j=1}^{10} (x_i - y_j) = 10\sum_{i=1}^{10} x_i - 10\sum_{j=1}^{10} y_j\) 3. \(\displaystyle \sum_{i=1}^{10} x_i y_i \neq \left(\sum_{i=1}^{10} x_i\right)\left(\sum_{i=1}^{10} y_i\right)\)
End of Chapter 01
Thank You! 🎓
Questions?

www.statmania.info | Abdullah Al Mahmud | Press space or arrow to change slides